How to Build Organizational Charts in Google Sheets
Looking for a fast way to make a basic org chart? Hate creating shapes and line diagrams by hand? Google Sheets is your answer for a fast and straightforward org chart solution. These instructions will walk you through the creation process and give helpful tips for sharing and customizing your org chart in less than 10 minutes.
Instructions
-
Create a table with 2 columns
Type or paste employee names in column A and the manager for each employee in column B. You can also structure your org chart by position by putting the name of the role in column A and who that role reports to in B.
Google Sheets org charts are easy to update when a new employee is added to your company. Just add the new employee or their position to column A, and who they report to in column B. Adding this info will automatically update the org chart.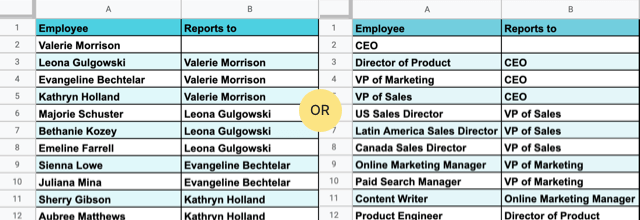
-
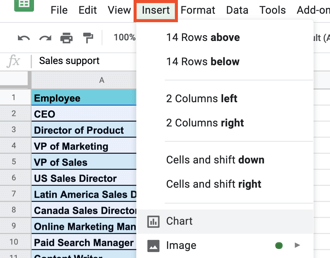
Insert a chart
Select all employees or roles and choose Chart from the Insert dropdown menu
-
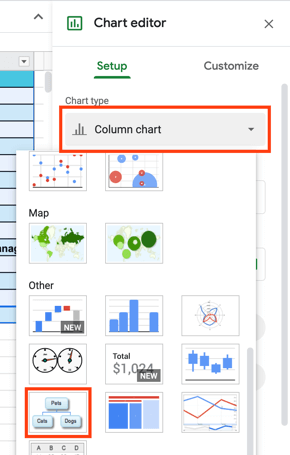
Choose organizational chart in the Chart Type dropdown menu
Open Chart Editor, scroll to the bottom of the Chart Type dropdown, and choose Organizational Chart. If your columns have headers (like "Employee" and "Reports to"), click "Use row 1 as headers" to correct your chart’s layout.
-
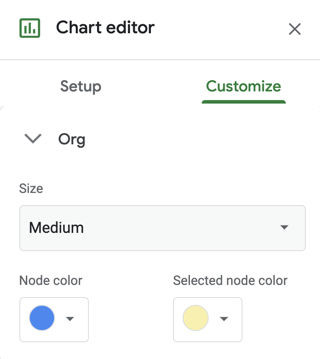
Customize your Google Sheets org chart
To make your org chart bigger or change the color of each employee card, click the Customize tab in Chart Editor
-
Include job titles for each employee by using ToolTips
Google Sheets org charts can display a second layer of data when people hover over one of the employee cards. To add another layer of data, create a third column in your Google Sheet and include that new column when choosing your data for the org chart. Then make sure to select Use row 1 as headers in the Chart Editor and choose the header in the third column in the ToolTip dropdown. This will make sure column 3 data shows up as a tooltip when you hover over the org chart you created.
In the below example, the org chart is organized by positions and the tooltip data is the employees’ names, which is another way to do it, depending on which data you want to be visible in the org chart and which you’d like visible when hovered over.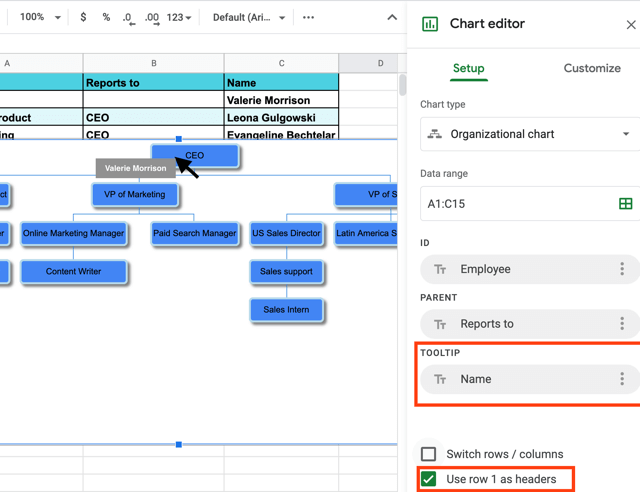
-
Share your Google Sheets org chart
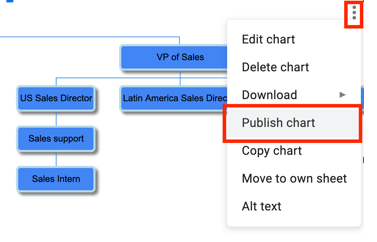
Share your org chart in Google Sheets by clicking on the three grey dots in the upper right corner of the org chart and selecting Publish chart.
-
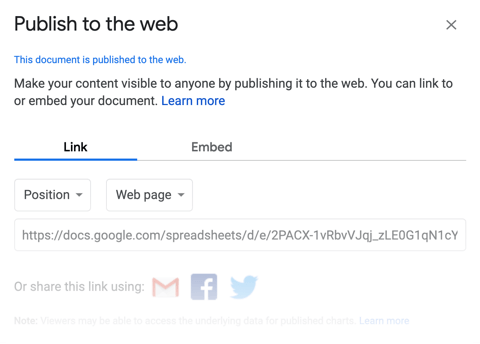
Publish your Google Sheets org chart
In the Publish menu, you can share your org chart via link, or you can download it in a PDF, CSV or TSV format. Another option is to embed the org chart on your website.
Free org chart templates for Google Sheets
Check out our org chart example and see how we implemented secondary employee data with ToolTips.