The Evolution of the Org Chart
Daniel McCallum’s Railroad Chart
The business organizational chart is by no means new. In fact, it was 1855 when the first such chart was drawn and it wasn’t called an org chart, an organizational chart, or even a business chart. It was referred to as a "Diagram representing a plan of organization exhibiting the division of administrative duties and showing the number and class of employees engaged in each department from the returns of September 1855." Clearly the person who gave the diagram its name wasn’t concerned with fancy titles (or ink), yet he did succeed in telling us exactly for what the diagram was to be used.
The railroad diagram looked like an intricate, flowery tree and was meant to illustrate the highly complex nature of the New York and Erie Railway system, along with some frills to make it pretty. Daniel McCallum is the Scottish-born genius, an American railroad engineer and general manager of the New York and Erie Railroad, credited to its design. George Holt Henshaw was the Canadian engineer and draftsman responsible for to its rendering. Just as its lengthy title asserts, the diagram depicts the various divisions of duties, and the number and types of employees in each department of the said railroad system of which McCallum was in charge.
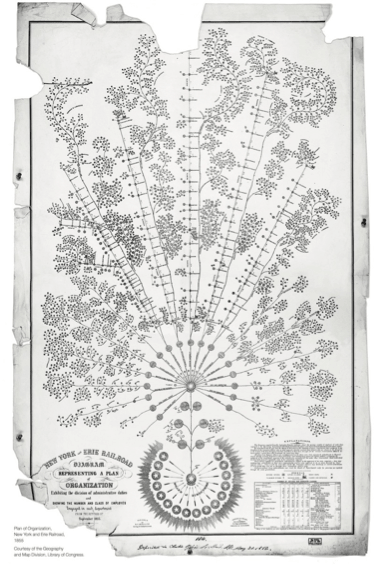
McCallum believed in the division of responsibilities and the necessity to make those roles and responsibilities transparent. By diagramming them, not only could a sense of order and control be established, but relationships could be better understood. This idea would spawn a variety of such drawings in the coming years.
The IBM Organizational Chart - Functional Organizational Structure
In 1896, Herman Hollerith formed the Tabulating Machine Company after being awarded a federal contract to develop a machine to count the influx of U.S. immigrants in the height of the Industrial Revolution. After several business and product launches and consolidations, the company was eventually renamed the Computing-Tabulating-Recording Company (CTR). The company was expanding rapidly, both geographically and functionally and needed a way to visualize the relationships and relative ranks of its job positions. It is undocumented as to whether Hollerith or anyone at CTR referenced McCallum’s work or if they came up with the idea on their own, but in 1917, a new type of organizational chart was birthed.
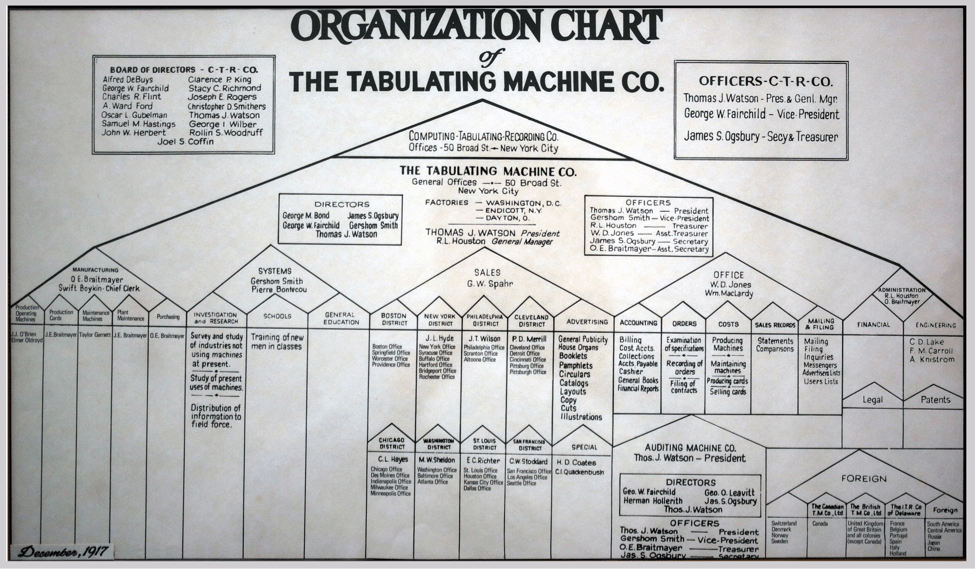
Instead of the more whimsical, tree-like figure of the railroad system, CTR drew their organizational structure in a highly symmetrical, pyramidal form. The relatively no-frills chart showed the functional divisions, as well as the geographical and departmental subcategories with their definitions. This chart may not have been as pretty as its predecessor but it offered much more detailed information. The company continued to grow and evolve and in 1924 was finally renamed International Business Machines, a.k.a IBM.
Product and Divisional Organizational Structure
IBM started a trend, as until the early 1950s, most U.S. companies were similarly functionally organized and drafted similar organization charts to illustrate its architecture. It wasn’t until the late 1950s-1960s that economic and product growth led to new complexities the functional structures could no longer accurately depict. Companies began to structure themselves around divisions and products instead.
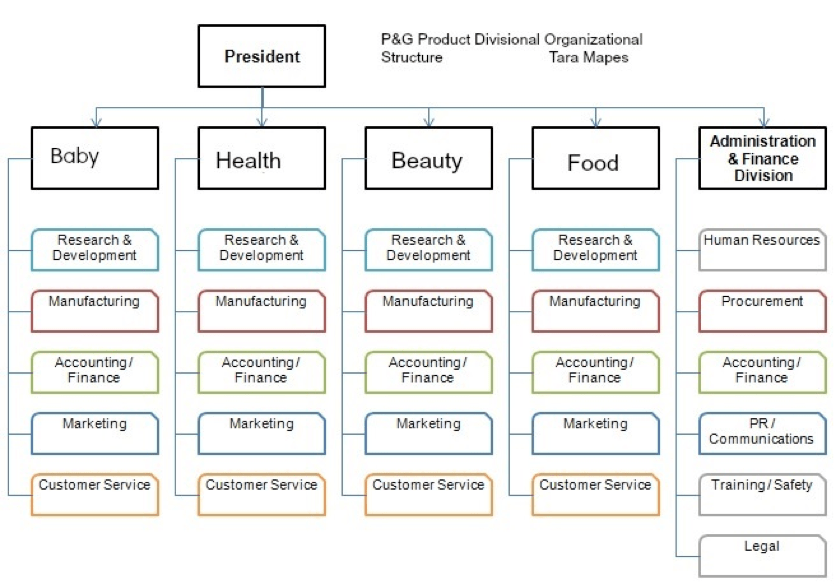
As with Proctor & Gamble depicted in the image above, these organizations believed it to be more efficient to run the various divisions or product groups as separate entities, each with its own functional areas. They concluded that by grouping jobs that require the same knowledge, skills and resources, they can be accomplished more efficiently. Everyone had a single job to do and they did it within their single team.
Matrix Organizational Structures
By 1970, globalization and increased regulations led to matrix structures. These organizations sought to combine functional and product/division structures to work on specific projects, such as a new product launch. Employees often report to more than one manager and their role may change depending on the project.
This new organizational structure enabled job skills and functions to be shared, rather than duplicated as with functionally structured organizations. Even though an employee may work in one area using a specific skillset, they had the opportunity to use those skills across departments and projects. This structure enabled employees to broaden their scope a bit and work more collaboratively, yet it still provided the structure and hierarchy of the more traditional organizations.
A New Age of Organizational Structures - Flat and Holacracy Structures
By 1970, peace and love weren’t the only symbols of freedom in this country. Organizations wanted to be free from organized structures that tried to constrain them or fit them into a box. Companies ditched the previous organizational structures and began creating their own, often resulting in hybrids of the past. These new structures meant the org chart could better illustrate the flexibility and creativity these organizations so emphatically espoused.
For nearly 50 years, organizations have been reinventing the organization chart. Recently flat and holacracy organizational structures have taken shape, removing the many, if not all, layers of authority in favor of only a few with wider spans of control.
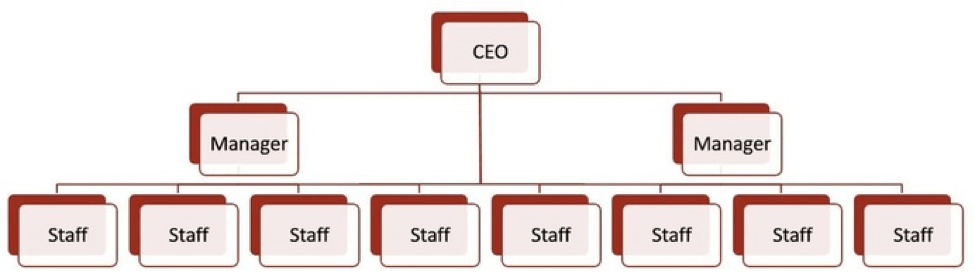
Particularly with holacracies, employees have the ability to work with multiple teams across various projects, sharing skills, data and responsibilities. Everyone is considered equal, job skills and data are shared, and there are little, if any, direct lines of command.
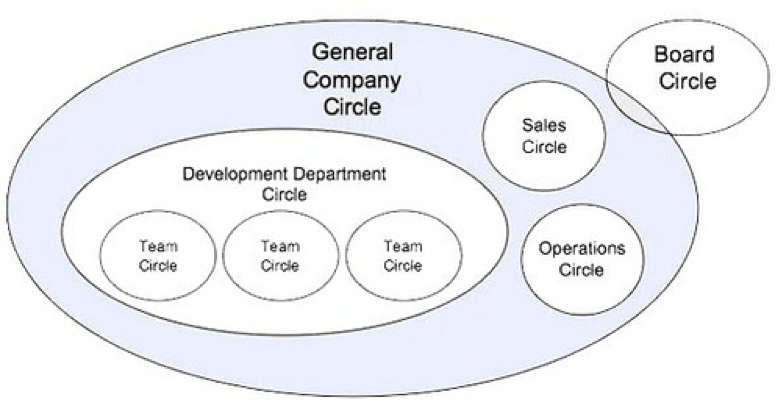
These free-form structures are much more challenging to depict in a traditional organizational chart. Some look more like intricate webs or even an unorganized knot of string, yet proponents believe it is the best way to foster collaboration, innovation and skill growth.
Only the more modern org chart software is capable of capturing such relationships. It is obvious the more structured business org charts and the software that people use to draw them are inadequate. Thankfully, the best org chart software is smarter, more flexible and perfectly suited for the changing organizational designs.
The Present and Future of Org Charts
How an organization is structured depends on how the company views its work processes and teams. These will be constant variables, ensuring the organizational chart will continue to evolve as cultural shifts, market demand, competitive jockeying and simple economics are at play. Businesses can usually be divided into one of two categories: those who respond to these drivers and those who drive the response.
It is unlikely that all of the org charts up til now will one day be considered archaic. Each has its own merits, borrows from each other, and works well for particular companies, even if only for a period of time. It is common for companies to restructure, whether in response to the drivers mentioned above or because they see an opportunity to reinvent themselves. New companies, of course, have the freedom to design themselves however they please yet as they grow, which is always the goal, they may find themselves in the same predicament as the larger companies who need some sort of structure to remain viable.
The future of organizational charts will continue to build upon the features being implemented as new technology emerges. In the past, business organization charts were designed using add-on features in software being used for other purposes, such as PowerPoint. Today, there are many solutions purposely built specifically for diagramming organizational structures. They come with features and functionalities that were unheard of and even unimaginable even a couple of decades ago.
Today’s best org chart software eliminates the hassles inherent with designing and occasionally referencing the old org chart and makes it a fully interactive experience that is easy to use by anyone. It presents the same information as the historic charts, with infinitely more detail and usability. The org chart has morphed from being a flat, one dimensional drawing to a valuable resource and asset to any company and every employee.
The org chart maker must serve the purpose of accurately depicting the present state of an organization, something org chart software of the past have struggled to do well. The minute there is a change to any position or job function, the org chart becomes outdated. As organizations constantly change, adding and modifying roles and relationships, the software must be able to keep pace by providing real-time updates only the cloud can afford. Instead of a person in HR or a manager feeling the burden of keeping the company chart up to date with certain information, employees can take the lead. This is where mobile apps are critical.
Our culture communicates and completes tasks in a totally new way than when most of the organizational structures were invented. People are using mobile apps to do many of their duties, both personally and professionally. They have come to expect their employer to give them the same flexibility and this trend will only continue. It isn’t difficult to imagine a world where everything we do is managed through a device, even building relationships with coworkers.
Org chart software has proven it can do much more than diagram a corporate structure. It is being used to connect people in ways that were previously impossible. Take, for instance, the distributed workforce so common in today’s marketplace. Companies are more global than ever and will have remote workers, satellite offices and facilities spread across the globe for the foreseeable future. While this diversity is exciting and expands opportunities, it also requires sophisticated tools to support employees and help them feel part of the team no matter where they are located.
The software may be a resource tool organizations increasingly depend upon to better integrate the employee base. By putting together the rich employee profile details, employee directory and the organizational chart into their hands of each employee, every employee can find who they need, when they need them. They can build relationships with people based on similarities non-dependent on geographical location. This fosters collaboration and teamwork, along with greater job satisfaction and employee retention.
Globalization and the distributed workforce will drive product organizations to innovate in order to find ways to keep employees connected and productive from anywhere and at all times. Org chart software will play a pivotal role in bridging divides yet it will require something every modern technology knows: simplicity is the key to engagement.
Org charts will need to continue to evolve to make it easier to implement, deploy, train and use so employees will readily adopt it and organizations can realize ROI faster. The cloud has changed the game when it comes to productivity yet we all can appreciate the fact that it won’t be the last technology to make such massive leaps. New technology is always reshaping how we communicate, work and live. The business org chart will always be of value, just as it has been since 1855. Yet it has proven it can extend its benefits far beyond simple diagrams of lines and boxes.
What new information will it provide besides names, titles, job function, contact information, skillsets, background information, interests and hobbies, likes and dislikes, and vacation schedules? Only time will tell yet if history teaches us anything, it’s that we likely cannot see or predict what’s coming next.