
Org charts are not just for names in a box and the lines that show reporting relationships. They can also be used to differentiate teams and illustrate accountabilities, both functionally and geographically. Org charts that clearly define individual and team accountabilities also explain which roles hold responsibilities for various functions, projects, and geographies, helping to support improved efficiency and enhanced employee engagement.
According to research conducted by McKinsey, organizations with clear and accountable roles are 76 percent more likely to possess top-quartile organizational health, a state characterized by a company’s ability to execute company strategic goals. Furthermore, when employees understand what they and their coworkers are accountable for, the company benefits from streamlined decision-making, better operational performance, and less chance of duplication or overlooked tasks.
There are many types of accountability charts, and you’ll need to implement one that reflects how your workforce is organized. Here are some of the different organizational strategies that reflect a range of accountabilities:
Simple/Flat Accountability Chart
With a simple, or flat, organizational structure, accountabilities are organized on an individual basis, and all or most employees may report to one senior leader, such as the president or CEO. Flat org charts may have only one or two levels, with individuals sharing accountability for the execution of company goals. Typically, this structure is more common in smaller companies, where decision-making is more democratic, and individuals often share responsibilities across functional and product lines. While a flat structure keeps bureaucracy at a minimum, and employees feel equally valued within the company, it can also lead to uncertainty about who is responsible for individual tasks, and it may not easily accommodate organizational growth.

Functional Accountability Chart
Functional accountability charts group individuals according to the function-specific tasks they perform. For example, within the accounting function, a team of accountants with distinct responsibilities and levels of accountability for accounting tasks reports to the controller. With this type of accountability chart, there are clear roles and responsibilities within each function. However, it may also create an environment where employees focus so much on their own functions that silos can form, and collaboration between functions can be hampered.
Product Accountability Chart
Organizing by product accountability assigns ownership according to product type or category. Accountability is assigned to a product leader, who may supervise individuals with various function accountabilities within the product group.
While the benefits of a product accountability chart include clear reporting lines and well-defined roles, there are some disadvantages, including the potential for lack of consistency in processes across different product groups and limited cross-product collaboration.
For example, the “Product Alpha” team may have R&D, production, and sales teams that are accountable for performing functions specific to Product Alpha within a company. While the benefits of a product accountability chart include clear reporting lines and well-defined roles, there are some disadvantages, including the potential for lack of consistency in processes across different product groups and limited cross-product collaboration.
An interactive example of a product accountability charts:
Ready to build your product accountability chart?


Geographic Accountability Chart
A geographic accountability chart assigns accountability by geographic region or territory.
The benefit of a geographic structure is that each region can develop processes and assign individual accountabilities to meet its own unique regional needs
Commonly seen in sales organizations, geographic org charts typically feature a regional manager who leads a team of employees specifically focused on activities within the region or territory. The benefit of a geographic structure is that each region can develop processes and assign individual accountabilities to meet its own unique regional needs. On the flip side, organizing by geography may lend itself to unhealthy competition and reduced collaboration between regions.
An interactive example of a geographic accountability charts:
Ready to build your geographic accountability chart?


Project Accountability Chart
Organizing by project accountabilities aligns individuals to specific projects or initiatives.
While organizing by project accountability provides individuals with the flexibility of working with different team members and also encourages new ideas to flow, it can also be a structure that is difficult for employees to understand, particularly when reporting lines change or blend.
In a project accountability chart, project leaders or process owners (who may or may not be the direct supervisors of the individuals working on the projects) have overall responsibility for the success of a project, and they assign accountabilities to individuals on the team. In this structure, departments and roles may be blended as new projects start and finish. While organizing by project accountability provides individuals with the flexibility of working with different team members and also encourages new ideas to flow, it can also be a structure that is difficult for employees to understand, particularly when reporting lines change or blend.
Ready to build your project accountability chart?


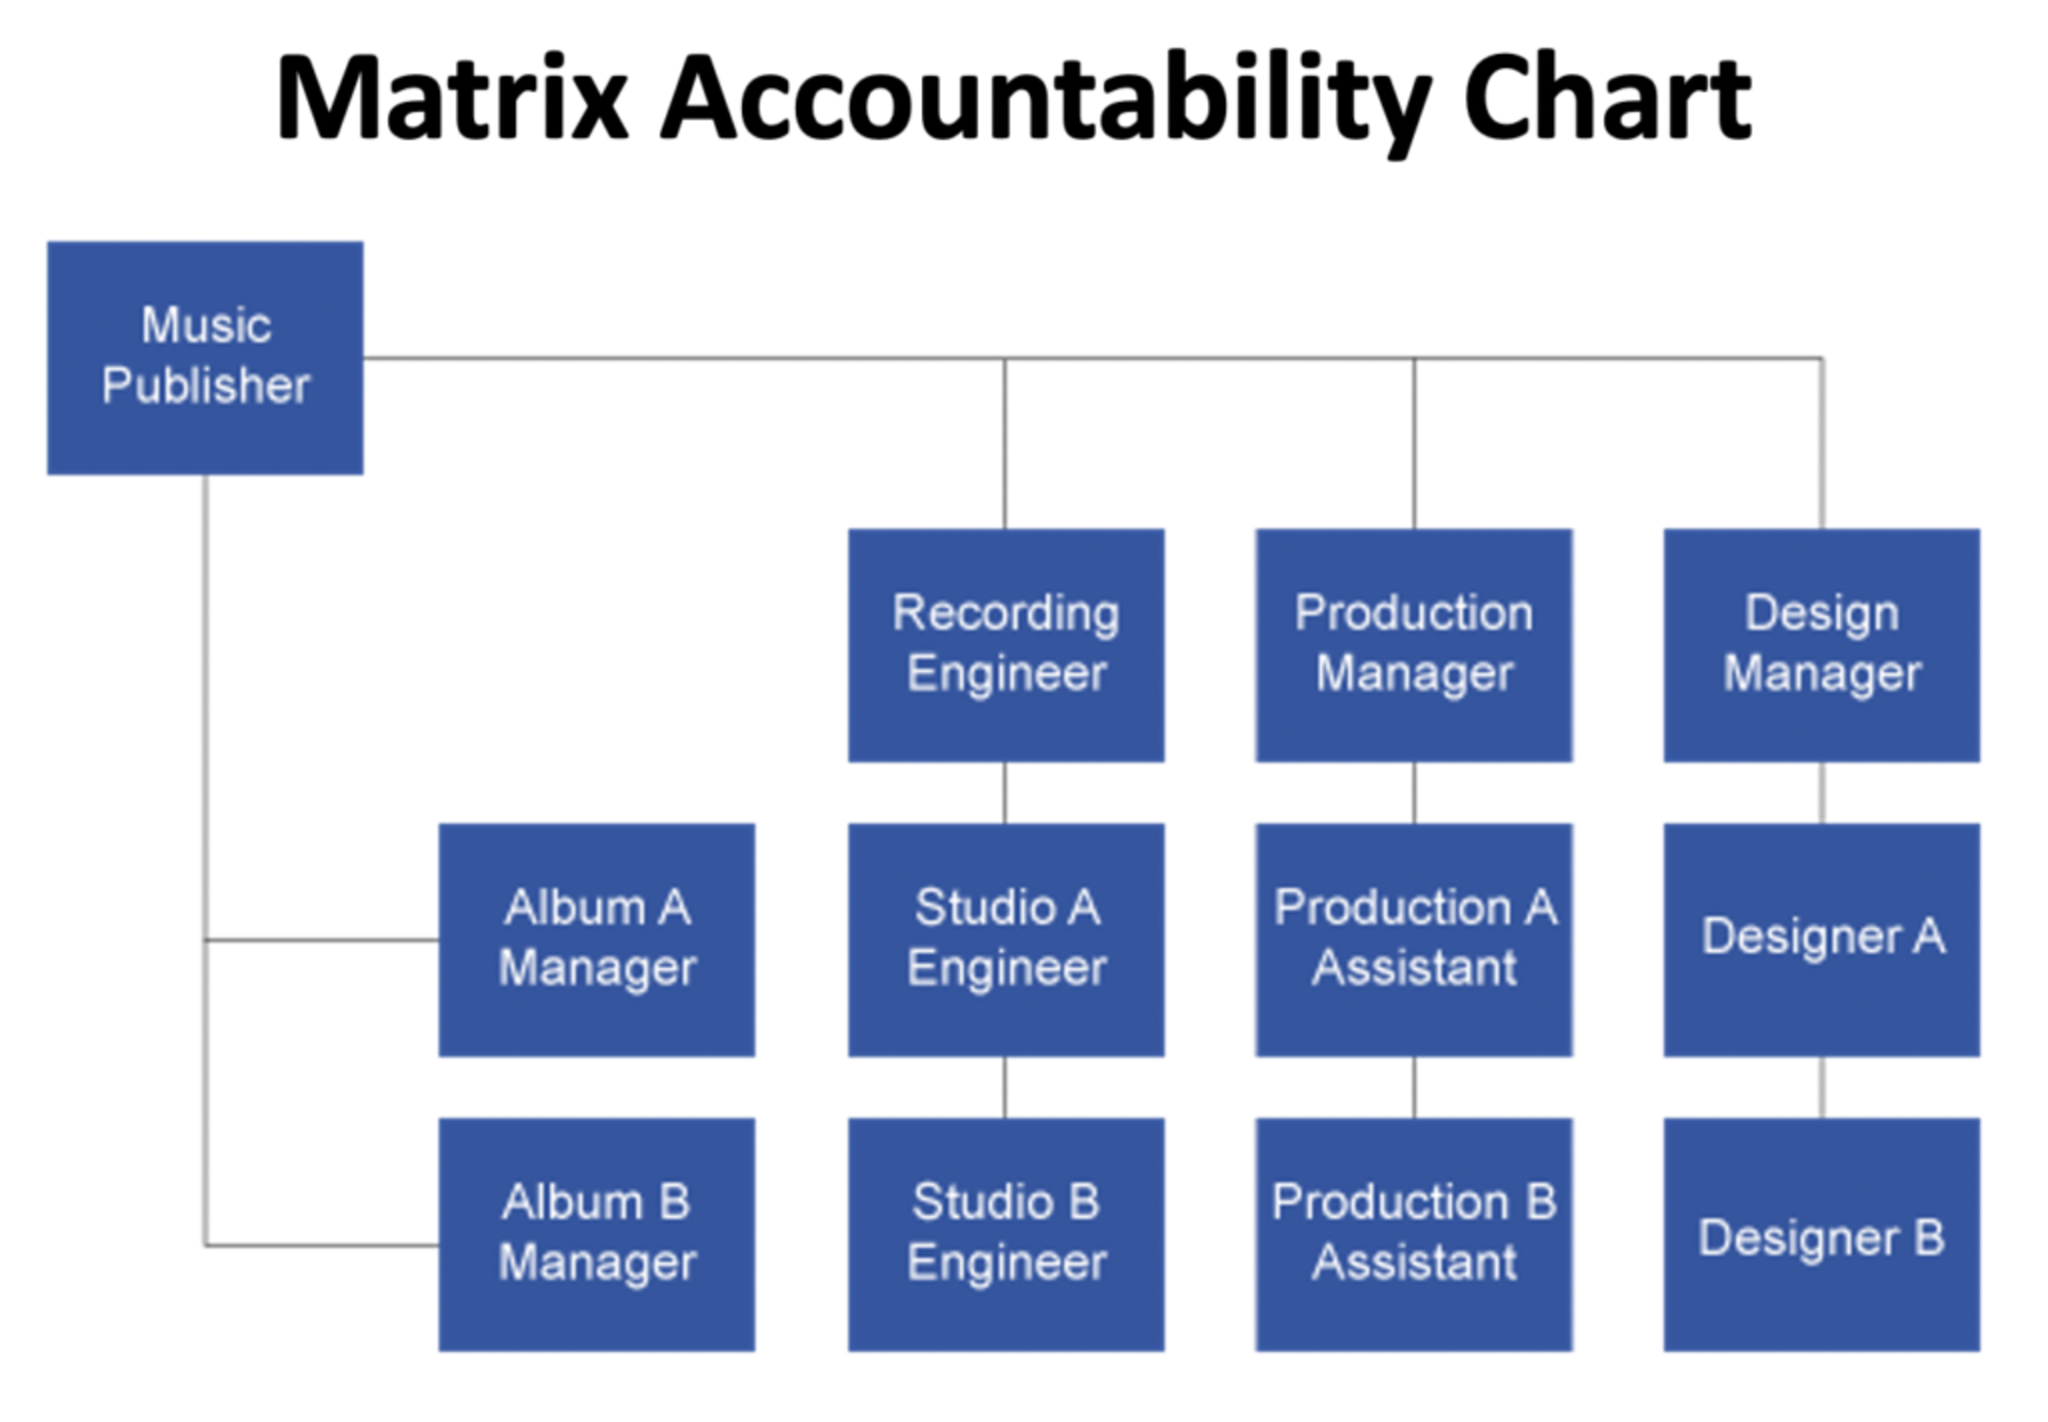
Matrix Accountability Chart
Not for the faint of heart, the matrix organization structure assigns accountability across a combination of products, functions, geographies, or projects. Matrix org charts are often complex and work particularly well for large organizations that offer broad ranges of products and services to customers in multiple geographies. Individuals in roles with matrix accountability may also have more than one direct line manager. For example, an HR manager might report to a head of HR as well as a division manager. The advantages of matrixed structures are increased collaboration across multiple functions and products and an expanded circle of influence for leaders. Conversely, matrix org charts can be confusing for employees, can sometimes lead to conflict between managers who share direct reports, and can make it difficult to prioritize key projects with varying functional or product objectives.

An effective accountability chart can help your organization bring clarity to roles and reporting relationships and can help ensure employees know who is ultimately responsible for what. Depending on how work is accomplished in your organization, one type of structure may be a better fit than another. Once you’ve determined the structure that best represents the levels of accountability owned by each employee, you can use dynamic live org charts to help employees understand not only what each individual is accountable for, but also where individuals and teams fit within the broader organization.
Connect your people now with Pingboard


Sign up for a free trial today
Get Started for Free
No credit card required